Quantum State Simulator
Interactive 3D visualization of quantum states on the Bloch sphere
Current State
|ψ⟩ = |0⟩
Probability Distributions
Real part of probability amplitudes
z-Basis
x-Basis
y-Basis
About this simulator
This simulator offers an interactive way to understand the state of a single qubit. You can rotate the qubit on the Bloch sphere, see how its amplitudes look in different bases, and observe how the probabilities of measurement outcomes shift in real time.
Bloch Sphere
The Bloch sphere is a standard representation of a qubit. Any single-qubit state can be visualized as a point on this sphere, with angles (theta) and (phi) defining its position. Moving the sliders changes these angles, letting you explore how the qubit's state evolves geometrically.
Probability Distributions
Alongside the Bloch sphere, the simulator shows measurement probabilities in various bases. These probabilities come from the squared magnitudes of the qubit's complex amplitudes. Switching between the computational basis, or z-basis, (, ), Hadamard basis, or x-basis, (, ), and the y-basis, (, ) reveals how different ways of measuring the same qubit can yield different outcomes.
Real part of probability amplitudes
These panels show a time-domain visualization of a qubit's amplitudes in different bases. Each wave represents the real part of the qubit's state component (e.g., vs. ), with a moving pulse that highlights phase evolution. Although we often think of a qubit as a point on the Bloch sphere, this wave-like depiction helps illustrate how the relative phases and magnitudes of the qubit's components change over time. It's an abstract but intuitive way to see 'inside' the qubit's superposition in the z-, x-, or y-basis.
Each component is drawn as an oscillating "real part" of the amplitude (plus a phase) rather than a static number. So even if the state is strictly (amplitude = 1 for , 0 for ), the real part will appear to swing from +1 to −1 over time because we factor in a rotating phase for visualization. This does not mean the probability is changing. The probability is the magnitude squared of the amplitude, which remains 1 at all times for .
Why It Matters
Quantum states can feel abstract, especially when juggling complex numbers and phases. This simulator helps bridge that gap by showing how changes to the qubit's state produce shifts in measurement probabilities, and how those same changes look in different bases. It's a hands-on way to build intuition about quantum superposition and measurement. Feel free to play with the sliders, watch the qubit rotate, and see how its probabilities and waveforms respond. By exploring the qubit's behavior in multiple bases, you'll gain a deeper appreciation for the subtleties of quantum mechanics, and, hopefully, a bit of fun along the way!
How to use
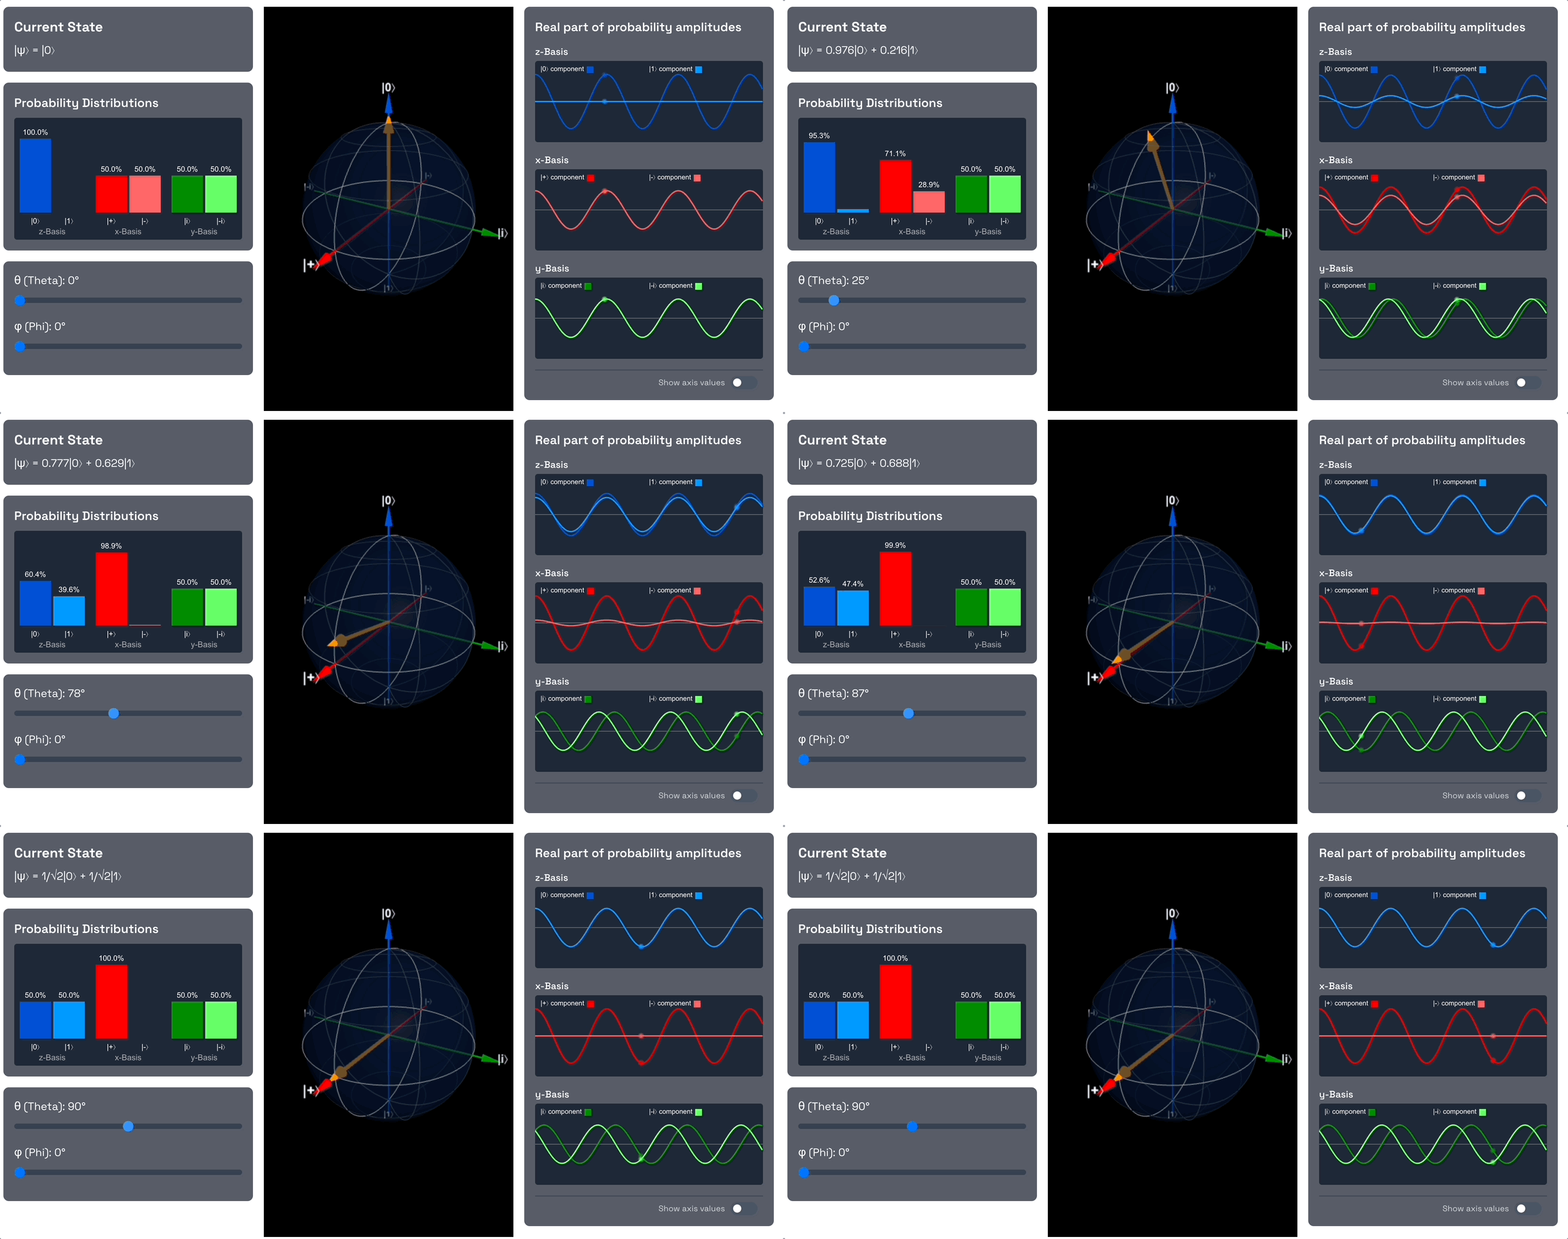
The qubit starts in the state, which is represented by the north pole of the Bloch sphere. Note that the component has a probability amplitude of 1, whereas the component has a probability amplitude of 0. Also note that in the x-basis, both the and components have a probability amplitude of .
Start by rotating the qubit into an equally weighted superposition of and by changing the theta angle to 90 degrees. As you do this, note the probability amplitude of the component increases from 0 to , and the probability amplitude of the component decreases from 1 to . This means that the qubit is now in a superposition of and , and the probability of measuring or is 1/2 each (the square of the magnitude of the amplitude).

Also note that in terms of the x-basis, the qubit is now in the state. As we increased the theta angle, we dialled down the probability amplitude of the component to 0, and increased the probability amplitude of the component to 1.
Another way to see this is by looking at the and states in terms of the z-basis:
and
So the state is obtained by adding the and states together, and the state is obtained by subtracting the state from the state. The probability amplitudes of the and states are exactly overlapping, they're in phase with each other. Adding them together, i.e. obtaining the reinforces them (constructive interference), while subtracting them, i.e. obtaining the cancels them out (destructive interference). That's why we end up with 100% measurement probability for and 0% for .
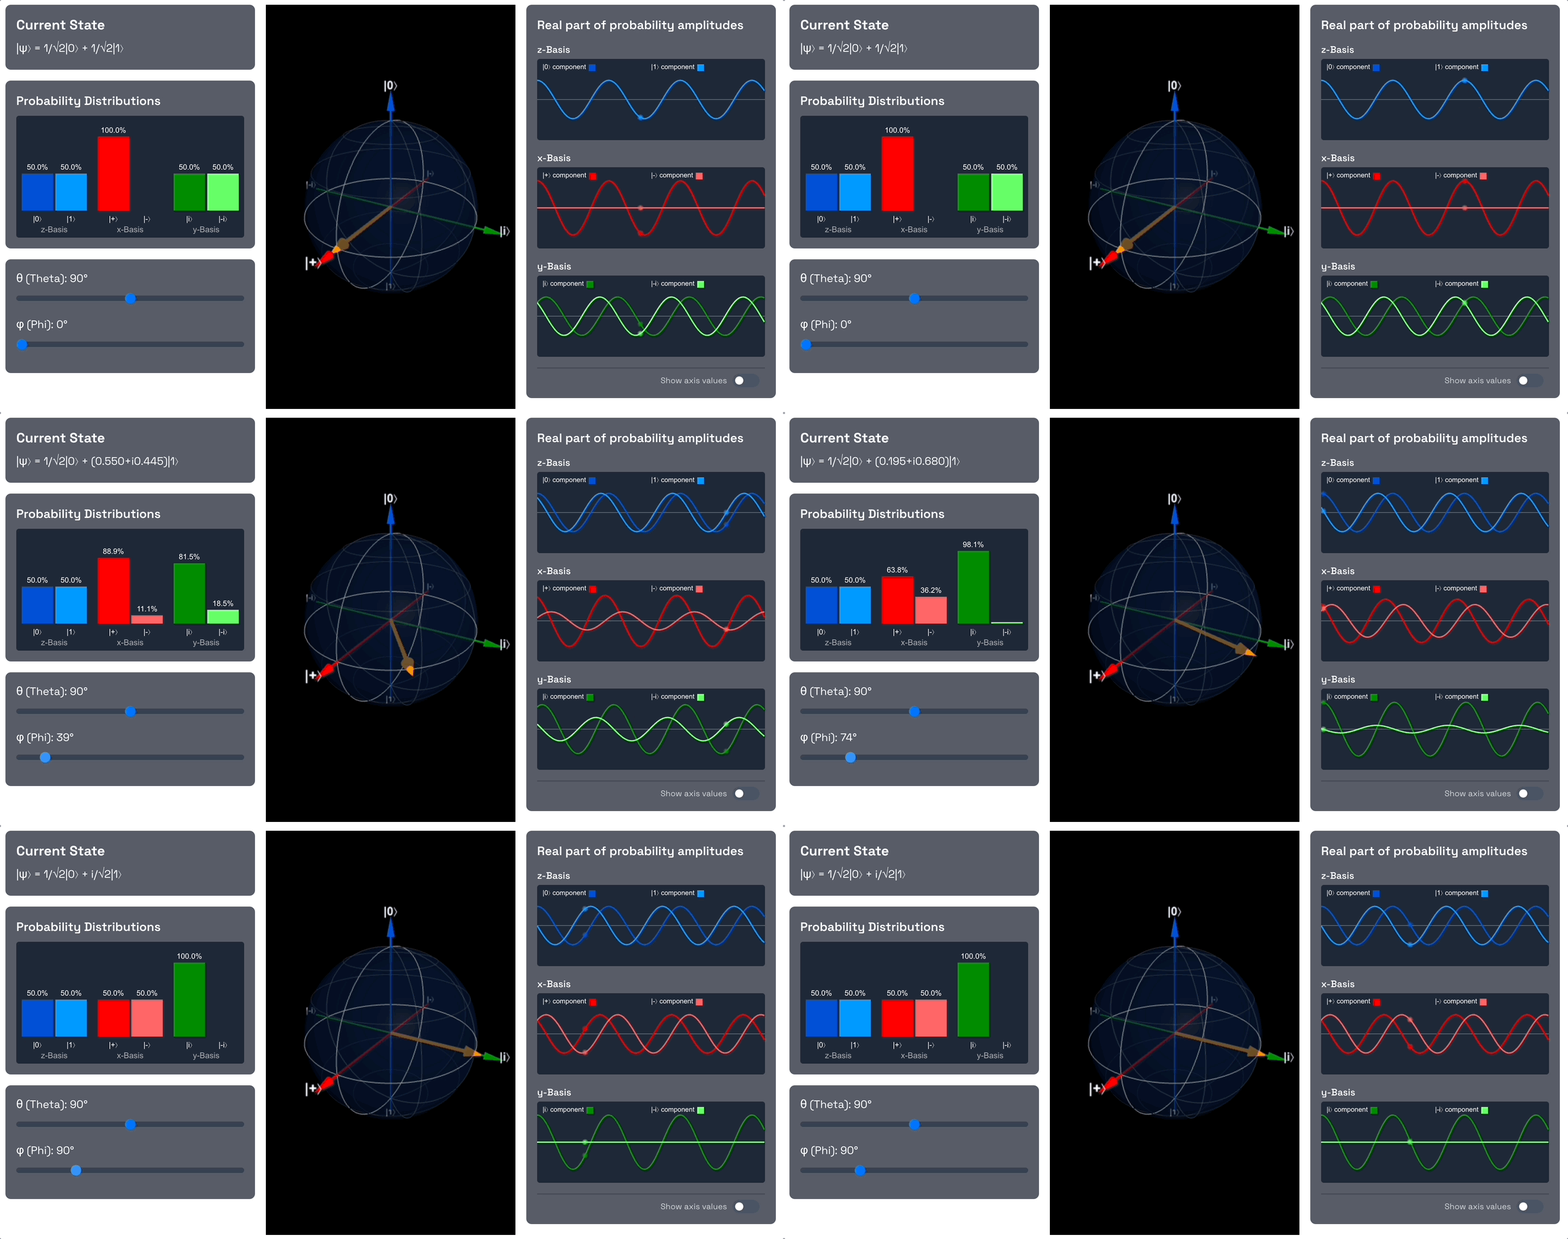
Now let's introduce a phase shift by changing the angle to 90 degrees.

Observe that we are introducing a phase shift, so the component is now out of phase with the component. The phase however doesn't change the probability amplitudes, so the measurement probabilities of and remain the same.
Also note that since we introduced a phase and the and components are no longer in phase, the probability amplitudes in the x-basis no longer exactly interfere with each other. We applied the exact rotation needed to end up with a 50% probability for and 50% probability for .
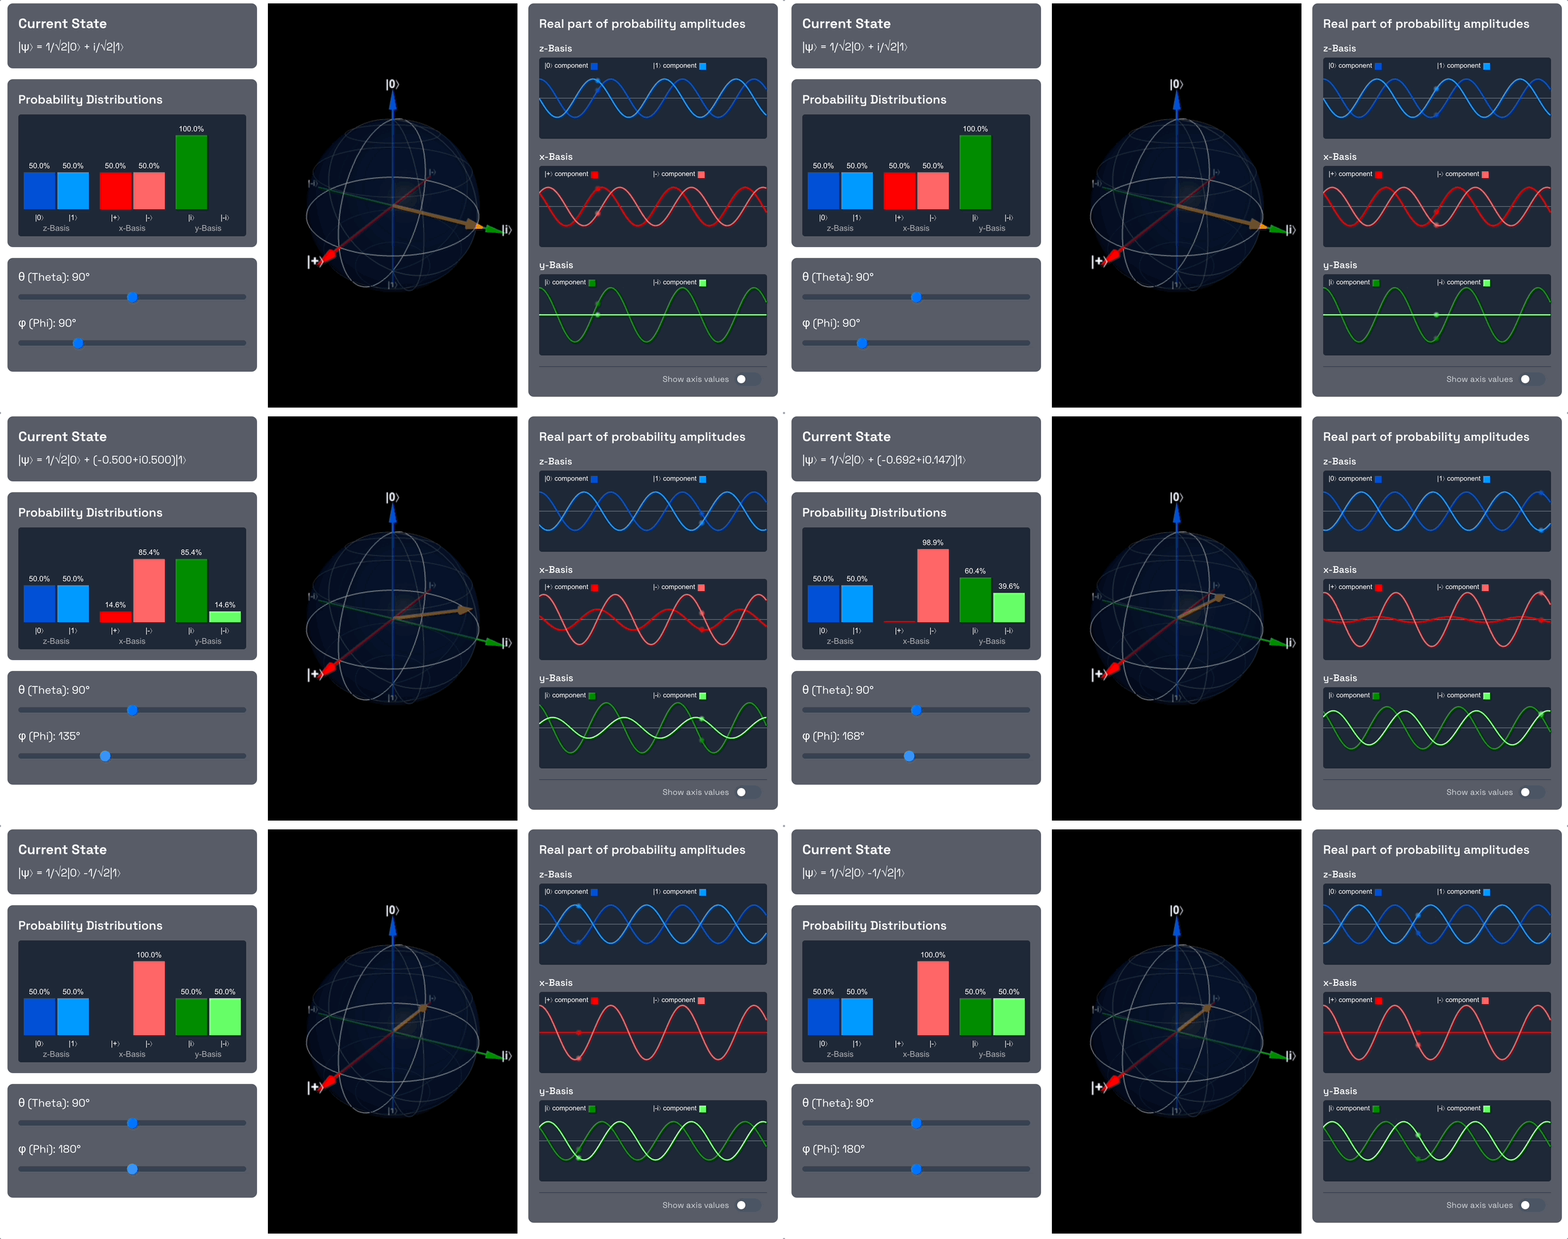
Lastly, let's see what happens when we change the angle all the way to 180 degrees.

Again, as we're just changing the phase, but not changing the probability amplitudes, the measurement probabilities of and remain the same. However, the phase we introduced is such that the probability amplitude of the component is now 0, and the probability amplitude of the component is now 1.
Where to go from here?
Congrats! We just travelled around the Bloch sphere and explored an important topic in quantum computing: single-qubit interference. If you're interested, read on here to learn more about quantum superposition and how that's different from classical mixed probabilities of states.